This R-based web crawler, available here...
1. Reads the HTML of a webpage from a given address,
2. Extracts the hyperlinks from that page to other pages and files,
3. Filters out links that fail to meet given criteria (e.g. other websites, already explored, and non-html)
4. Stores the origin and destinations of the remaining links,
5. Selects a link from those discovered so far, and returns to 1.
The scraper can be used to gather raw data from thousands of pages from a website, and reveal information of the network of links between them. For example, starting just now at the front page of the National Post website, the crawler visited a news article, the main page for horoscopes, the day's horoscopes, and an article from the financial pages of the paper.
Saturday 31 October 2015
Wednesday 28 October 2015
Take-home lessons and code from a factor-cluster analysis with imputation
Recently I was tapped to examine data from a survey of ~200 children to find if their learning preferences fell into well-defined profiles (i.e. clusters). The relevant part of the survey had more than 50 Likert scale questions The client and I had decided that a factor analysis, followed by a cluster analysis would be most appropriate.
I learned some things in doing this analysis, and wanted to share that and some relevant code.
Sunday 18 October 2015
Teaching Philosophy Statement on Intro Math/Stats - Cartographers of Knowledge
In the digital age, a teacher's role is not simply to present knowledge, but to navigate it. The overwhelming majority of the information that an undergraduate gains in her degree is available for free on the internet or in libraries.
A digital age instructor's job is to guide and motivate students' paths through this information – to provide the vision and context necessary to develop expertise in a field. Introductory courses make up the bulk of students' collective experience with mathematics and statistics, so any expertise to be gained in those one or two courses needs to be a self-contained package.
For example, rigorous proofs serve introductory students very little; the practice of rigor and constructing proofs has little value until upper-division courses. Introductory students learn by doing the tasks that are actually relevant to the course: examples. As such, I prefer to relegate much of the proof work to optional out-of-class readings. The extra instructional time for guided, step-by-step examples makes the material more accessible. It also provides more opportunities to fill the fundamental gaps from high school mathematics that will otherwise prevent understanding. For the few that do continue in a mathematics or statistics major, I feel that what they may lack in experience with proofs is more than compensated by a stronger foundation in the introductory material.
This focus on accessibility extends to my policies on assignments and office hours. Assignments should be vehicles for students to struggle through a set of practice problems and receive formative feedback. However, logistics of providing quality feedback aside, that doesn't work for everyone. Assignments need to have grades attached so students will have extrinsic motivation to completing them, but these same grades penalize mistakes on something that should be practice.
I want assignments to be important and challenging enough to take seriously, but not so much as to tempt plagiarism. In the past, I have solved this by booking extra office hours on the days before assignments are due, and telling my students that I will give them entire solutions to assignment questions. I've found that on these office days, a group of 5-12 students would come to my office with their assignment hang-ups, but that they could answer each others' questions with only moderate guidance from me. Some of these students likely sat in to get their solutions from the rest of the office group, but that's still better than copying written assignments verbatim.
Finally, I try to explicitly declare the 'take-home messages' by including them in my lessons. That is, the few ideas that I hope students will remember long after the final exam is over. These messages include general strategies about the mathematical sciences such as “every hard problem is merely a collection of easy problems”, and George Box's quote “all models are wrong, some are useful.”. If my students are to retain anything from their time spent on coursework, I hope it's something of value and general applicability rather than memories of referring to tables of integrals and probability.
Monday 12 October 2015
Now you're thinking with gates!
What do Nintendo and Bitcoin enthusiasts have in common? They weren't content with solving their problems through software advancements alone. The statistical computing field shouldn't be either.
-------------------
The Super Nintendo Entertainment System is a cartridge-based system, meaning that its games were stored on circuit boards encased in plastic cartridges. Unlike disc-based media of most later generations of game consoles, the contents of cartridges were not restricted to read-only data. The most common addition to game cartridges was a small cache of re-writable memory used to store progress data in the cartridge.
Originally, active objects in games, called sprites, could only be displayed as one of a set of pre-drawn frames. That's why sprite animations are usually simple loops of a few frames, and why characters are rarely seen changing size as they move towards or away from the player's point of view.
However, later games also included special-purpose microchips that expanded the graphical capabilities of the Super Nintendo console itself. One of these chips allowed the SNES to change the way sprites look as the game was happening, which made sprites look much more alive. This chip also allowed for rudimentary three-dimensional rendering.
Any software workaround to get these effects using only the hardware given in the Super Nintendo would have taking much longer and produced much worse results, if any at all. The video on the Super Nintendo (SNES) by video game trivia group Did You Know Gaming covers these effects and the chips in more detail, and shows some great demonstrations.
------------------
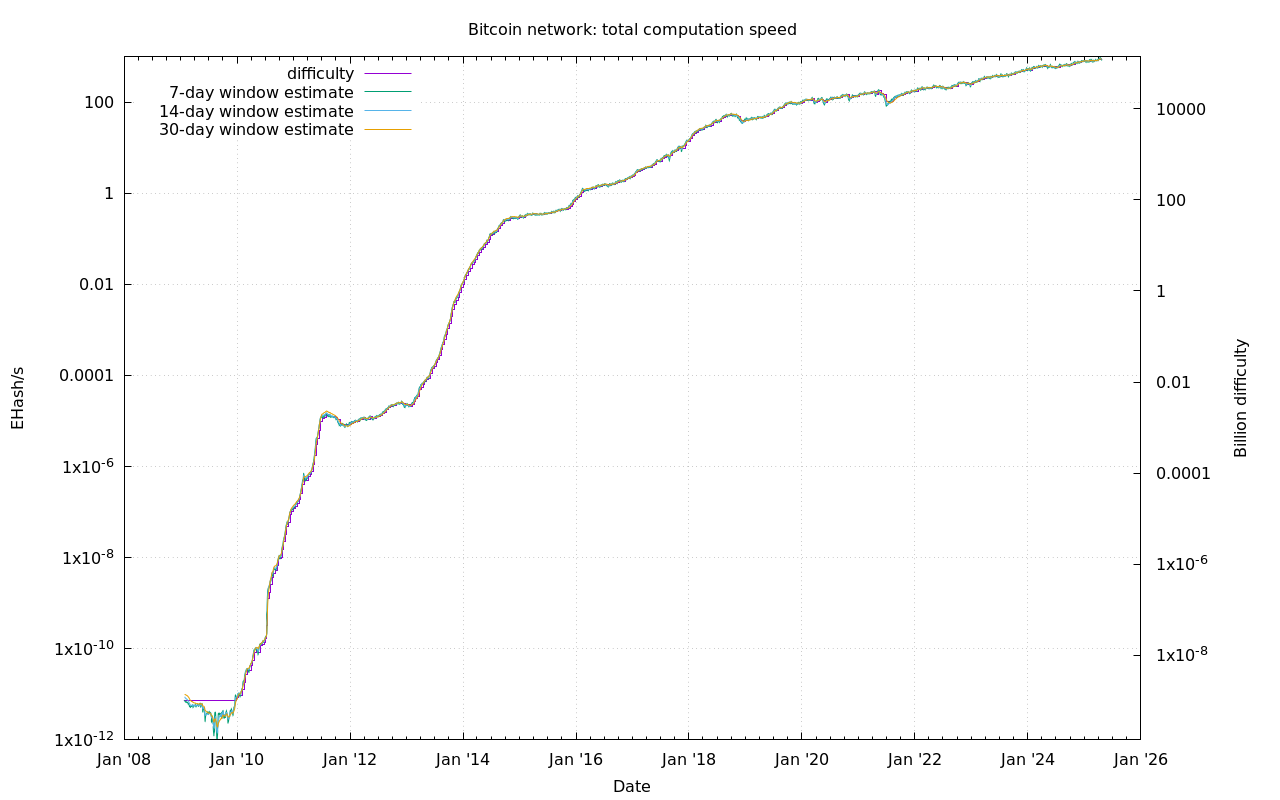
Bitcoin, is a cryptocurrency. Part of what gives it value is the premise that it is computationally hard to create or 'mine' for new ones. In fact, there is a self-adjustment mechanism that increases the mining difficulty in proportion to the total computing power of all miners.
I've appended this historical chart of the log of the total computer power (and the log difficulty), over time with the two hardware advancements that defined the trend in bitcoin mining power.

-------------------
The Super Nintendo Entertainment System is a cartridge-based system, meaning that its games were stored on circuit boards encased in plastic cartridges. Unlike disc-based media of most later generations of game consoles, the contents of cartridges were not restricted to read-only data. The most common addition to game cartridges was a small cache of re-writable memory used to store progress data in the cartridge.
Originally, active objects in games, called sprites, could only be displayed as one of a set of pre-drawn frames. That's why sprite animations are usually simple loops of a few frames, and why characters are rarely seen changing size as they move towards or away from the player's point of view.
However, later games also included special-purpose microchips that expanded the graphical capabilities of the Super Nintendo console itself. One of these chips allowed the SNES to change the way sprites look as the game was happening, which made sprites look much more alive. This chip also allowed for rudimentary three-dimensional rendering.
Any software workaround to get these effects using only the hardware given in the Super Nintendo would have taking much longer and produced much worse results, if any at all. The video on the Super Nintendo (SNES) by video game trivia group Did You Know Gaming covers these effects and the chips in more detail, and shows some great demonstrations.
------------------
Bitcoin, is a cryptocurrency. Part of what gives it value is the premise that it is computationally hard to create or 'mine' for new ones. In fact, there is a self-adjustment mechanism that increases the mining difficulty in proportion to the total computing power of all miners.
I've appended this historical chart of the log of the total computer power (and the log difficulty), over time with the two hardware advancements that defined the trend in bitcoin mining power.

The first event represents the first time mining using a more specialized graphical processing unit (GPU) rather than a more general central processing unit (CPU) was made publicly possible. Since many miners had compatible graphics cards already, we see a tenfold jump in power almost instantly.
The second event represents the first time mining using a single-purpose processor, called an ASIC* was introduced to the market. This time, another rapid increase in processing power is sparked, but without the initial leap.
An ASIC is orders of magnitude faster at the simple, repetitive task of mining bitcoins than a GPU is, and a GPU mines orders of magnitude faster than a comparably priced CPU. In both cases, the new hardware quickly rendered any previous mining methods obsolete.
* Application Specific Integrated Circuit.
---------------
When developing new methods to solve computational problems, a software approach usually works best. The results of purely software-based are often portable as packaged programs, and the dissemination of improvements can be as quick and as cheap as a software update. The feedback loop of testing and improvement is very quick, and there are many languages such as the R, SAS, and Julia that can make software-based solutions a routine task.
Making hardware to solve a problem may sound insane by comparison - why would anyone willingly give up all of those advantages? This is where Field Programmable Gate Arrays come in. An FPGA is essentially a circuit board that can be programmed down to the gate level. That is, a user can write a program in terms of the fundamental particles of computation, OR, NOT, XOR, AND, and NAND gates.
The FPGA takes a set of gate instructions and physically wires itself into the programmed configuration. When set, the FPGA is essentially an ASIC, an processor that can only do one task but potentially much faster than a general purpose computer. However, if needed, an FPGA can be re-programmed, so the advantage of a quick trial-and-error turnaround is there. Also, the program can be disseminated like any other software. The most popular FPGAs cost between $200 and $500 USD.
The bitcoin ASIC started off as an FPGA. Once the FPGA program was made, it took about a year for the first ASICs to be sold. This is encouraging for anyone looking towards FPGAs for the next great leap in statistical computing, as it means the endeavor has commercial viability. Just think how much faster some common methods could become even if only large matrix inversion was made faster.
It's time to start thinking with gates.
Subscribe to:
Posts (Atom)